
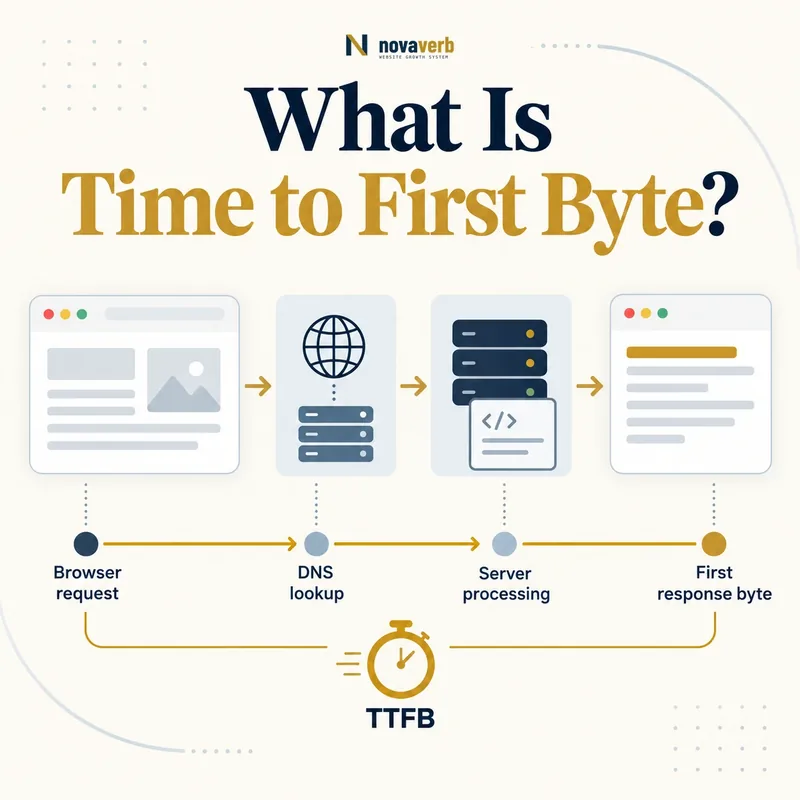
What Is Time to First Byte?
TTFB is a foundational timing metric because no document content can be parsed before the response begins. It can be measured in a browser, synthetic test or server-adjacent tool, but those tools may start and end the clock differently. Browser navigation timing includes work before the application handles the request, such as DNS lookup, connection establishment and secure negotiation when a reusable connection is unavailable. A fast origin does not guarantee fast field TTFB if visitors are far away or redirect through several hosts. Likewise, a slow TTFB does not identify the cause by itself. The value must be decomposed into network, cache and application phases.
- Begins at navigation start in browser measurement
- Ends when the first response byte arrives
- Can include redirects and connection setup
- Includes network travel and server processing
- Differs across cache and connection states
- Precedes document parsing and later paint metrics
- Frame the decision raised by What Is Time to First Byte.
- Render the page with its required scripts and resources.
- Compare content, links, metadata and canonical signals.
- Trace each difference to the responsible template or script.
- Apply the fix and repeat both observations.
| Question | Answer | Why it matters |
|---|---|---|
| What is timed? | Navigation to first response byte | Measures response start |
| What is included? | Network, redirects and server work | Multiple owners |
| Which resource? | Usually main document | Starts page delivery |
| Is it render time? | No | Content still must parse and paint |
| Can caches affect it? | Yes | Edge and browser state matter |
| Does one test prove it? | No | Location and connection vary |
TTFB becomes actionable only when the total is separated into the connection, cache and origin work that produced it.
What Is a Good TTFB?
TTFB is not itself a Core Web Vital, so the threshold is diagnostic rather than a universal pass-fail requirement. A server-rendered page can spend slightly longer generating complete HTML and still produce strong visible-content timing. A client-rendered shell may return quickly yet delay meaningful content through bundles and APIs. Segment field observations by device, region, connection reuse, route and cache outcome. The 75th percentile is useful for monitoring the majority experience, but trace slower cohorts when business-important visitors cluster in a distant market. Protect improvements against stale-cache or personalization shortcuts that would make the response faster but wrong.
- Good rough guide: 0.8 seconds or less
- Needs improvement: above 0.8 through 1.8 seconds
- Poor: above 1.8 seconds
- Interpret alongside content delivery strategy
- Segment routes, regions and cache states
- Never trade response truth for a faster number
- Frame the decision raised by What Is a Good TTFB.
- Render the page with its required scripts and resources.
- Compare content, links, metadata and canonical signals.
- Trace each difference to the responsible template or script.
- Apply the fix and repeat both observations.
| Range | Meaning | Action |
|---|---|---|
| ≤ 0.8 s | Good rough guide | Protect and monitor |
| > 0.8–1.8 s | Needs improvement | Decompose phases |
| > 1.8 s | Poor | Prioritize shared bottleneck |
| Fast shell, slow content | Client dependency issue | Trace later rendering |
| Slow uncached only | Origin or generation work | Review cache and queries |
| One region slow | Distance or routing | Review edge placement |
Use the TTFB range as an investigation guide while judging success through accurate content delivery and downstream user outcomes.
How Is TTFB Measured?
Navigation timing exposes redirect, DNS, connection, secure connection, request and response milestones. Subtracting requestStart from responseStart isolates the request-to-first-byte interval more narrowly, while navigation start includes preceding work. A warm persistent connection can remove DNS and handshake costs that a cold visitor experiences. A service worker or local cache can alter the path. Synthetic tools may report one controlled location, while field data reflects real networks and devices. Document exactly which timestamp pair a dashboard uses before comparing systems. Also capture server timing or trace identifiers where possible so browser outcomes can be reconciled with edge and origin logs.
- Choose the measurement scope and timestamp pair.
- Record redirects before the final request.
- Separate DNS, connection and secure negotiation.
- Measure requestStart to responseStart.
- Label cold, warm and cache-hit states.
- Segment synthetic and field observations.
- Join browser timing with edge and origin evidence.
- Evidence for How Is TTFB Measured: the raw html returned by the server
- The rendered DOM after required scripts run
- Content, links and metadata that differ between those states
- Network, console and hydration failures tied to the page
- A repeatable test at the exact URL and device context
| Milestone | Meaning | Diagnostic value |
|---|---|---|
| navigationStart | Navigation begins | Broad user timing |
| redirectEnd | Redirect sequence ends | Redirect cost |
| domainLookupEnd | DNS resolution ends | Resolver cost |
| connectEnd | Connection ready | Transport cost |
| requestStart | Request begins | Narrow server/network start |
| responseStart | First byte received | TTFB endpoint |
Reliable TTFB comparison requires the same timing definition, connection state and route context in every dataset.
What Causes Slow TTFB?
The browser sees only the combined outcome, so use layered evidence. Multiple canonical redirects add round trips before the final route begins. A visitor far from the origin pays transport latency. A CDN may forward every request because cookies or cache headers make the response uncacheable. The application can wait on database locks, broad queries, template work or a third-party API. Cold serverless or container startup can affect infrequent routes. Traffic spikes reveal constrained worker pools or connection limits. Personalization can make caching difficult, but public and private output should be separated rather than giving up on all caching. Group findings by route and cache state to avoid blaming infrastructure for one slow query.
- Redirect chains before the final document
- Slow DNS, connection or secure negotiation
- Long distance between visitor and serving edge
- Cache misses or bypassed public responses
- Database queries, locks or connection pressure
- Synchronous third-party dependencies
- Cold startup or constrained application workers
- Frame the decision raised by What Causes Slow TTFB.
- Render the page with its required scripts and resources.
- Compare content, links, metadata and canonical signals.
- Trace each difference to the responsible template or script.
- Apply the fix and repeat both observations.
| Layer | Cause | Evidence |
|---|---|---|
| Routing | Redirect chain | Navigation trace |
| Network | Distance or handshake | Regional connection timing |
| Edge | Miss or bypass | Cache-status header |
| Origin | Worker or CPU pressure | Server telemetry |
| Database | Slow query or lock | Query trace |
| Dependency | External API wait | Distributed trace |
The correct TTFB fix belongs to the slowest proven layer, not whichever team happens to own the visible page.
How Do Caching and CDNs Improve TTFB?
Public pages with identical output can often use shared edge caching. The cache key must include every dimension that legitimately changes the response, such as locale when routes share a host. It should not include arbitrary tracking parameters or cookies that fragment identical content. Authenticated and personalized pages require private handling so one user’s content never appears in another response. Event-based invalidation can keep product and article changes timely without forcing every request to render at the origin. Stale-while-revalidate patterns may preserve availability when the content policy permits. Inspect actual hit, miss and bypass headers rather than assuming a CDN hostname means the page is cached.
- Separate public and personalized output
- Normalize cache keys to real content identity
- Include locale and required variants
- Exclude irrelevant tracking dimensions
- Define freshness and event invalidation
- Measure edge hit, miss and bypass behavior
- Frame the decision raised by How Do Caching and CDNs Improve TTFB.
- Render the page with its required scripts and resources.
- Compare content, links, metadata and canonical signals.
- Trace each difference to the responsible template or script.
- Apply the fix and repeat both observations.
| Decision | Good behavior | Risk |
|---|---|---|
| Public response | Shared edge reuse | Stale content |
| Personalized route | Private isolation | User-data leak |
| Cache key | Only output-changing dimensions | Fragmentation |
| Invalidation | Timely content updates | Persistent old page |
| Miss handling | Bounded origin work | Traffic stampede |
| Observability | Hit status visible | False cache assumptions |
Caching improves TTFB only when the faster response remains the correct response for the requested route, locale and user state.
How Do Server Rendering and Databases Affect TTFB?
A route should fetch only the data needed for its initial truthful output. Broad queries, N+1 access patterns and serialized calls increase generation time. Index and query changes require real-plan evidence rather than guesswork. Cache stable fragments or complete public responses when policy allows. Server-side rendering can deliver complete HTML, but expensive components should not block the entire document when they can load after the core response without hiding page meaning. Streaming can start bytes earlier, yet a fast first byte followed by a long stalled body may not improve useful display. Trace time to headers, first byte, last byte and meaningful content together.
- Fetch only data required for initial content
- Remove repeated and serialized query patterns
- Bound external dependency timeouts
- Cache stable public fragments or pages
- Stream only when useful content can progress
- Measure complete response and paint outcomes
- Frame the decision raised by How Do Server Rendering and Databases Affect TTFB.
- Render the page with its required scripts and resources.
- Compare content, links, metadata and canonical signals.
- Trace each difference to the responsible template or script.
- Apply the fix and repeat both observations.
| Finding | Fix direction | Truth check |
|---|---|---|
| N+1 queries | Batch or prefetch data | Same complete content |
| Slow database plan | Index or rewrite with evidence | Correct result set |
| External wait | Timeout or decouple | Honest fallback |
| Heavy template | Simplify shared render | All fields present |
| Cold startup | Warm or right-size service | Cost and reliability |
| Early empty stream | Move useful markup earlier | Downstream LCP |
Origin optimization is successful when it starts an accurate useful response sooner, not when it emits an empty byte merely to improve one timestamp.
How Do You Improve Time to First Byte?
Start with phase evidence and route segmentation. Fix a two-hop canonical redirect before tuning application code that has not started yet. If edge misses dominate, repair cache identity and invalidation. If origin time dominates, trace requests through database, templates and external services. Separate public responses from personalized paths so safe content can be reused. Monitor tail latency and error behavior under load; an optimization that collapses during traffic spikes is not complete. Then verify downstream Largest Contentful Paint, because lower TTFB should translate into earlier useful content rather than a faster shell followed by client delay.
- Segment TTFB by route, region and cache state.
- Remove avoidable redirects.
- Serve public content from an appropriate edge.
- Repair cache keys and invalidation.
- Trace and reduce origin processing.
- Optimize database and dependency waits.
- Test representative load and failure states.
- Verify downstream content timing.
- Evidence for How Do You Improve Time to First Byte: the raw html returned by the server
- The rendered DOM after required scripts run
- Content, links and metadata that differ between those states
- Network, console and hydration failures tied to the page
- A repeatable test at the exact URL and device context
| Finding | Candidate fix | Verification |
|---|---|---|
| Redirect delay | One canonical hop | All entry variants |
| Regional latency | Edge placement | Target-market field data |
| Cache bypass | Key and header correction | Content identity |
| Slow origin | Profile shared work | Response accuracy |
| Database delay | Query-plan improvement | Correct data |
| Dependency wait | Timeout or decouple | Honest fallback |
The strongest TTFB improvement removes the largest proven delay while preserving response status, content freshness and user isolation.
How Do You Audit TTFB?
Begin with the 75th percentile by target region, route family and device population. Select canonical, redirected, cached, uncached, personalized and recently updated URLs. Capture navigation timing, headers, protocol, connection reuse and response bytes. Repeat tests because cache and connection state materially change results. Use request IDs or tracing to follow slow samples through edge, application and database layers. Compare time to first byte with response completion and rendered content. Pair the audit with render-blocking resource and client-rendering evidence when downstream page display remains slow.
- Segment field TTFB by region and route.
- Select redirect, hit, miss and private examples.
- Capture navigation and connection milestones.
- Inspect cache and response headers.
- Trace edge, origin, query and dependency time.
- Repeat cold and warm measurements.
- Compare first byte with useful content timing.
- Monitor production after each fix.
- Evidence for How Do You Audit TTFB: the raw html returned by the server
- The rendered DOM after required scripts run
- Content, links and metadata that differ between those states
- Network, console and hydration failures tied to the page
- A repeatable test at the exact URL and device context
| Check | Evidence | Pass condition |
|---|---|---|
| Population | Regional percentiles | Affected cohort known |
| Redirects | Navigation trace | Minimal canonical hops |
| Connection | DNS and TLS timing | No avoidable setup |
| Cache | Hit-status evidence | Correct reuse |
| Origin | Server trace | Bounded processing |
| Database | Query telemetry | No dominant wait |
| Dependencies | Distributed trace | Resilient path |
| Outcome | LCP and response timing | Useful improvement |
Start with a relevant free SEO check, continue the evidence workflow in Crawl Explorer, and review pricing when comparing continuous monitoring with a one-time manual review.
A complete TTFB audit links a real-user response delay to one network, cache or origin phase and verifies the downstream effect on useful content.