
What Is Total Blocking Time?
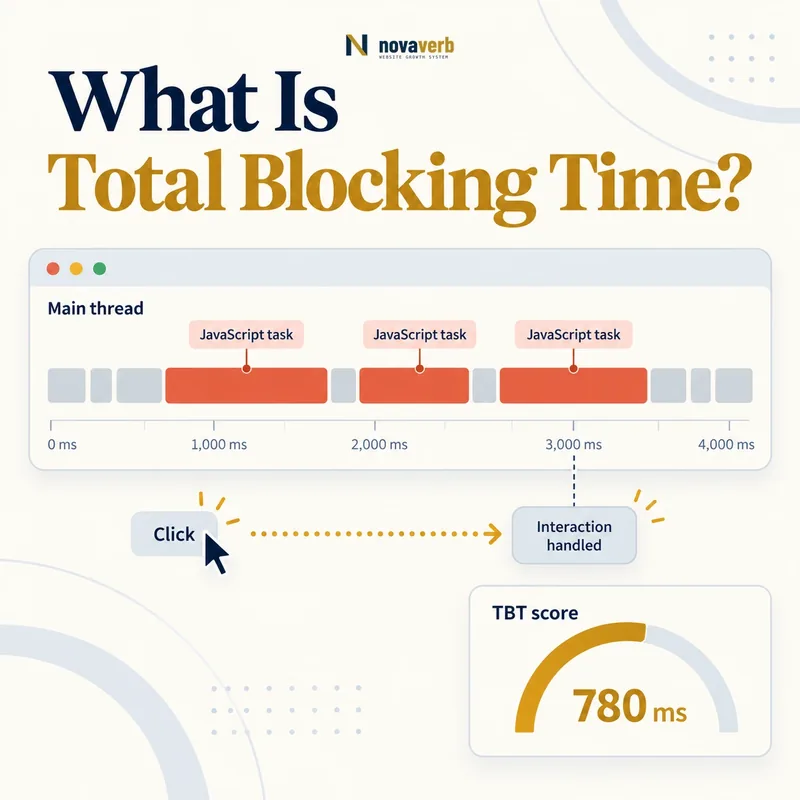
The browser’s main thread parses HTML, executes most JavaScript, calculates styles, performs layout and coordinates rendering. It handles one task at a time. When a task runs longer than 50 milliseconds, the time beyond that threshold is considered blocking time because an input arriving during that portion may have to wait. TBT adds those blocking portions across the selected trace window. It does not prove that a visitor actually interacted during a task, and it is not a field Core Web Vital. Its strength is controlled diagnosis: it quantifies how much potentially unresponsive main-thread time a page creates while loading.
- Measured primarily in controlled lab tests
- Focuses main-thread long tasks
- Counts only time beyond 50 milliseconds per task
- Usually starts at First Contentful Paint
- Often ends at Time to Interactive
- Indicates potential load responsiveness problems
- Frame the decision raised by What Is Total Blocking Time.
- Render the page with its required scripts and resources.
- Compare content, links, metadata and canonical signals.
- Trace each difference to the responsible template or script.
- Apply the fix and repeat both observations.
| Question | Answer | Why it matters |
|---|---|---|
| What is summed? | Blocking portions of long tasks | Quantifies main-thread pressure |
| Long-task threshold | More than 50 ms | Separates short work |
| Typical window | FCP to TTI | Focuses loading phase |
| Measurement type | Lab metric | Controlled comparison |
| Is input required? | No | Potential rather than observed delay |
| Is it Core Web Vital? | No | Diagnostic, not field outcome |
TBT is most valuable as a laboratory explanation of main-thread congestion, not as a substitute for real-user interaction evidence.
What Is a Good Total Blocking Time?
TBT is sensitive to CPU throttling, hardware, browser version, cache state, network setup and the endpoint chosen by the tool. A desktop run can hide execution cost that becomes severe on a mid-range phone. One fast run can also miss asynchronous work that appears under different timing. Use repeated tests with a stable configuration and compare like with like. The target helps prioritize work but does not guarantee responsive field interactions. A page can have low load-time TBT and still run a heavy callback after a visitor opens a later modal. Pair lab results with Interaction to Next Paint field data.
- Target less than 200 milliseconds in a representative lab
- Keep device and CPU profile consistent
- Use the same browser and audit version
- Repeat runs to reduce variance
- Compare equivalent cache and route states
- Validate real interactions in field data
- Frame the decision raised by What Is a Good Total Blocking Time.
- Render the page with its required scripts and resources.
- Compare content, links, metadata and canonical signals.
- Trace each difference to the responsible template or script.
- Apply the fix and repeat both observations.
| Observation | Meaning | Action |
|---|---|---|
| < 200 ms | Strong lab target | Protect against regression |
| High on mobile only | CPU sensitivity | Reduce execution cost |
| High one template | Shared route code | Fix template bundle |
| High variance | Timing or third-party instability | Repeat and inspect traces |
| Low TBT, poor INP | Later interaction issue | Profile real target |
| High TBT, good INP | Potential load congestion | Review user timing |
Use the 200-millisecond target within a stable lab contract and confirm that improvements benefit real interactions rather than only the audit score.
How Is Total Blocking Time Calculated?
A 70-millisecond task contributes 20 milliseconds. A 250-millisecond task contributes 200 milliseconds. A 40-millisecond task contributes none, although many short tasks can still consume substantial total CPU. The threshold reflects the browser’s inability to interrupt a running task and the growing chance that input waits noticeably. Tools commonly measure after FCP because the concern is a page that shows content yet remains difficult to use while long tasks continue. The end of the window must be documented; Lighthouse commonly uses Time to Interactive, while other traces may sum over a different duration. Never compare totals from different windows without labeling them.
- Choose the controlled trace window.
- List main-thread tasks inside that window.
- Identify tasks longer than 50 milliseconds.
- Subtract 50 milliseconds from each long task.
- Sum the remaining blocking portions.
- Record device, tool and route context.
- Evidence for How Is Total Blocking Time Calculated: the raw html returned by the server
- The rendered DOM after required scripts run
- Content, links and metadata that differ between those states
- Network, console and hydration failures tied to the page
- A repeatable test at the exact URL and device context
| Task duration | Blocking portion | Reason |
|---|---|---|
| 35 ms | 0 ms | Below threshold |
| 50 ms | 0 ms | No excess |
| 70 ms | 20 ms | 70 minus 50 |
| 90 ms | 40 ms | 90 minus 50 |
| 155 ms | 105 ms | 155 minus 50 |
| 250 ms | 200 ms | 250 minus 50 |
TBT calculation is simple, but useful comparison depends on a consistent window and representative hardware.
Total Blocking Time vs INP and Time to Interactive
TBT can flag a page that spends much of loading in long tasks even when no synthetic interaction occurs. INP observes what happened when real users clicked, tapped or typed and includes input, processing and presentation delay. TTI is a milestone used by some tools to define the end of the load-interactivity window, but it can be sensitive to quiet-window assumptions. A low TBT often supports stronger INP, yet the correlation is not perfect. A slow interaction after the load window may hurt INP without changing TBT. A large load task may raise TBT even if users rarely interact then. Use TBT for repeatable root-cause work and INP for population outcome.
- TBT: laboratory main-thread blocking sum
- INP: field interaction responsiveness outcome
- TTI: estimated reliable-interactivity milestone
- FCP: start of the common TBT window
- Long tasks can affect several metrics
- Metrics should not be substituted blindly
- Frame the decision raised by Total Blocking Time vs INP and Time to Interactive.
- Render the page with its required scripts and resources.
- Compare content, links, metadata and canonical signals.
- Trace each difference to the responsible template or script.
- Apply the fix and repeat both observations.
| Metric | Data source | Question |
|---|---|---|
| TBT | Lab | How much load-time blocking exists? |
| INP | Field | How slow were real interactions? |
| TTI | Lab | When did sustained interactivity arrive? |
| FCP | Field or lab | When did first content appear? |
| Long tasks | Trace/API | Which tasks monopolized the thread? |
| Long frames | Field or trace | Which frames delayed rendering? |
Use TBT to diagnose controlled loading work and INP to verify whether real visitors experience responsive interactions.
What Causes High Total Blocking Time?
Downloaded bytes matter because they must often be parsed and executed, but bundle size alone does not identify the task. A small script can run an expensive loop or query thousands of nodes. A framework may hydrate an entire page even though only a few controls need behavior. Tag managers can load several vendors whose work overlaps on the main thread. JSON parsing and state normalization can create large startup tasks. CSS and DOM changes can trigger synchronous style and layout calculation inside JavaScript call stacks. Inspect the task’s attribution, call tree and initiator. Group third-party and first-party work separately so optimization ownership remains clear.
- Unused JavaScript parsing and execution
- Large synchronous application initialization
- Whole-page hydration
- Third-party tag and vendor work
- Heavy JSON parsing or state setup
- Broad DOM queries and repeated rendering
- Forced style and layout calculations
- Frame the decision raised by What Causes High Total Blocking Time.
- Render the page with its required scripts and resources.
- Compare content, links, metadata and canonical signals.
- Trace each difference to the responsible template or script.
- Apply the fix and repeat both observations.
| Cause | Trace symptom | Owner |
|---|---|---|
| Large bundle | Long compile and evaluate tasks | Build/application |
| Hydration | Long activation task | Framework/component |
| Third party | Vendor-attributed tasks | Marketing/vendor |
| Data parsing | Long parse call stack | Data layer |
| DOM work | Large scripting and layout sequence | UI component |
| Polyfills | Legacy code execution | Compatibility strategy |
The highest-value TBT fixes remove or split the specific long tasks proven in the trace rather than optimizing JavaScript by file size alone.
How Do You Reduce Long Main-Thread Tasks?
Start with the largest blocking contributors. Remove dead code and route-inappropriate features before tuning execution. Break loops, initialization and rendering into units that leave the application in consistent states. Commit the minimum visible update first, then continue secondary work when safe. A worker can handle appropriate computation, but serialization and messaging create cost. Batch DOM reads before writes to avoid forced layout. Selective hydration can reduce activation work when public content remains stable HTML. Yielding improves scheduling only if tasks are actually decomposed; wrapping one enormous synchronous function in a timer does not make its internal work interruptible.
- Rank long tasks by blocking contribution.
- Remove code the route does not need.
- Split necessary work at safe state boundaries.
- Yield between computation units.
- Reduce DOM query and update scope.
- Move suitable pure work to a worker.
- Retest functionality and interaction timing.
- Evidence for How Do You Reduce Long Main-Thread Tasks: the raw html returned by the server
- The rendered DOM after required scripts run
- Content, links and metadata that differ between those states
- Network, console and hydration failures tied to the page
- A repeatable test at the exact URL and device context
| Technique | Benefit | Risk |
|---|---|---|
| Remove unused code | Eliminates work entirely | Missing hidden feature |
| Route splitting | Smaller startup scope | Cold feature fetch |
| Task chunking | More scheduling opportunities | State complexity |
| Yielding | Lets input and paint proceed | Too much overhead |
| Worker | Moves computation | Messaging cost |
| DOM batching | Reduces forced layout | Stale measurement |
Reduce blocking time by creating smaller, necessary units of work while preserving correct state and primary actions.
How Do Third-Party Scripts Affect TBT?
A small bootstrap request can load a much larger execution chain, so inspect initiators and task attribution rather than only script tag size. Define which vendors are necessary before first interaction and delay the rest. Load independent scripts asynchronously when their ordering allows, but remember that async changes scheduling rather than execution cost. Tag-manager governance should prevent duplicate tools and uncontrolled triggers. Consent decisions must remain accurate; performance work cannot bypass required privacy behavior. Test vendor failure, slow response and post-load activity. A third party may contribute little during one lab run and much more when an auction, experiment or chat initialization activates.
- Inventory vendors and their loaded descendants
- Assign an owner and purpose to each tool
- Delay nonessential vendors until appropriate
- Remove duplicate analytics and experiments
- Limit triggers and data-layer churn
- Test consent, failure and active vendor states
- Frame the decision raised by How Do Third-Party Scripts Affect TBT.
- Render the page with its required scripts and resources.
- Compare content, links, metadata and canonical signals.
- Trace each difference to the responsible template or script.
- Apply the fix and repeat both observations.
| Control | Purpose | Verification |
|---|---|---|
| Vendor inventory | Expose execution footprint | Initiator tree |
| Business owner | Create accountability | Renewal review |
| Delayed loading | Protect critical path | Feature timing |
| Async scheduling | Avoid parser block | Order and errors |
| Trigger limits | Reduce repeated work | Tag-manager events |
| Removal | Eliminate unused tool | Business outcome |
Third-party performance improves when every vendor has a measured execution cost, a named purpose and a deliberate loading boundary.
How Do You Improve and Audit TBT?
Select representative route families and use the same device, CPU, network, browser and audit version. Run several times and examine the median alongside variance. Record FCP, the TBT window and each long task. Attribute tasks to bundles, modules, components and vendors. Inspect client rendering, resource scheduling and hydration where startup dominates. Make one class of change at a time, then rerun the full route set. Verify primary actions, keyboard behavior and data correctness. Finally, monitor field INP because a lower lab TBT is valuable only when real responsiveness stays correct or improves.
- Define a stable representative lab profile.
- Test important route families repeatedly.
- Capture FCP, TTI and long-task traces.
- Rank blocking contribution by owner.
- Remove, split or reschedule proven work.
- Regression-test primary actions.
- Compare TBT under the same profile.
- Validate field INP after release.
- Evidence for How Do You Improve and Audit TBT: the raw html returned by the server
- The rendered DOM after required scripts run
- Content, links and metadata that differ between those states
- Network, console and hydration failures tied to the page
- A repeatable test at the exact URL and device context
| Check | Evidence | Pass condition |
|---|---|---|
| Lab contract | Saved test profile | Repeatable conditions |
| Window | FCP-to-end timestamps | Comparable totals |
| Long tasks | Trace list | Largest contributors known |
| Attribution | Call tree and initiator | Owner identified |
| Third parties | Vendor task totals | Deliberate loading |
| Functionality | Action test suite | No broken behavior |
| Regression | Route comparison | Shared gains |
| Field outcome | INP trend | Real responsiveness protected |
Start with a relevant free SEO check, continue the evidence workflow in Crawl Explorer, and review pricing when comparing continuous monitoring with a one-time manual review.
A complete TBT audit connects a repeatable laboratory score to specific long tasks, named owners and verified real-user responsiveness.