
What Is Interaction to Next Paint?
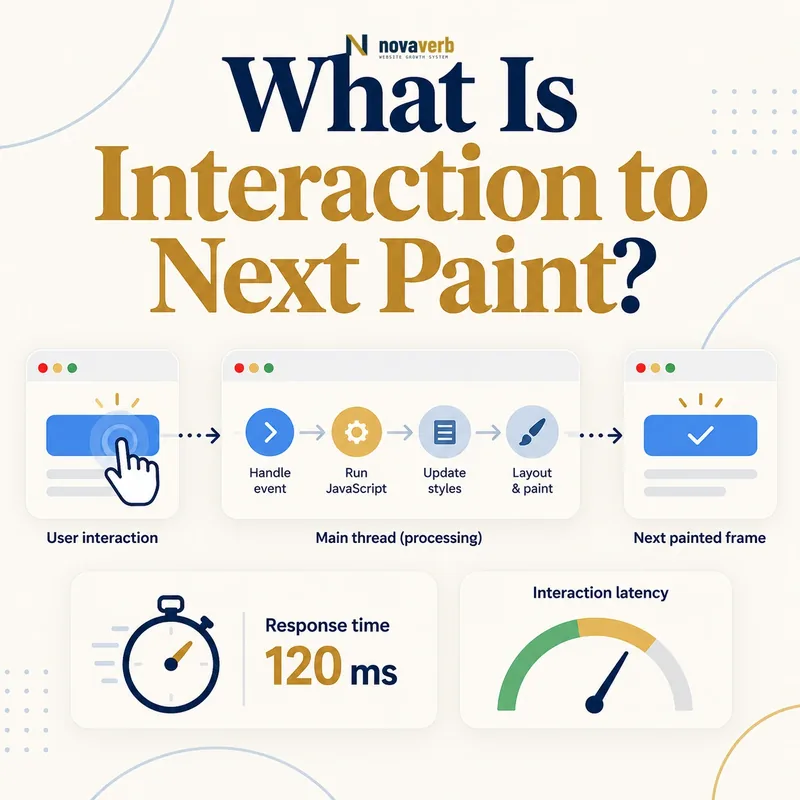
An interaction begins when a visitor provides input and ends when the browser presents the next visual frame associated with that interaction. INP looks beyond the first input, so it can reveal controls that become slow after the page has loaded. For most visits, the longest observed interaction becomes the value; visits with many interactions use an outlier adjustment so one random hiccup does not dominate indefinitely. INP is a field-oriented outcome. A page with no interactions cannot produce a meaningful interaction sample for that visit. Diagnosis requires attribution to the target, event handlers and latency phases rather than one route-level number.
- Observes clicks, taps and keyboard interactions
- Measures throughout the page visit
- Ends at the next presented frame
- Represents a high-latency interaction
- Varies by device and interaction mix
- Needs field attribution for diagnosis
- Frame the decision raised by What Is Interaction to Next Paint.
- Render the page with its required scripts and resources.
- Compare content, links, metadata and canonical signals.
- Trace each difference to the responsible template or script.
- Apply the fix and repeat both observations.
| Question | Answer | Why it matters |
|---|---|---|
| What is measured? | Interaction latency | Represents responsiveness |
| Which inputs? | Click, tap and keyboard | Not every event type |
| Time span | Entire visit | Finds later problems |
| Endpoint | Next presented frame | Includes rendering wait |
| Reported value | High-latency representative interaction | Focuses worst experience |
| Primary source | Field interaction data | Needs real usage |
INP becomes actionable when the reported latency is tied to the exact interaction, component and delay phase that produced it.
What Is a Good INP Score?
Percentile evaluation matters because device speed, browser workload and interaction choices vary substantially. Desktop traffic can mask weaker mobile responsiveness, so separate the populations. Route averages can also hide a slow checkout, filter or navigation component. A value near the good boundary still deserves regression protection, especially when new tags or application code ship frequently. Use thresholds to prioritize affected route families and interaction types, then inspect real attribution. Do not optimize only the initial page load when the slow interaction happens minutes later in a modal, form or dynamically loaded panel.
- Good: 200 milliseconds or less
- Needs improvement: above 200 through 500 milliseconds
- Poor: above 500 milliseconds
- Evaluate the 75th percentile
- Separate mobile and desktop visits
- Segment route and interaction types
- Frame the decision raised by What Is a Good INP Score.
- Render the page with its required scripts and resources.
- Compare content, links, metadata and canonical signals.
- Trace each difference to the responsible template or script.
- Apply the fix and repeat both observations.
| Range | Classification | Action |
|---|---|---|
| ≤ 200 ms | Good | Protect against regression |
| > 200–500 ms | Needs improvement | Find dominant phase |
| > 500 ms | Poor | Prioritize shared blockers |
| Fast desktop, slow mobile | Device capability issue | Reduce main-thread work |
| One slow component | Interaction-specific defect | Fix shared component |
| Release regression | New code or third party | Review change timeline |
Use INP thresholds to find affected user populations, then repair the interaction path rather than chasing a sitewide average.
How Is INP Calculated?
A single user action can create multiple browser events. Pointer input may include down, up and click handlers that belong to one interaction. The interaction duration reflects the longest relevant event duration in that group rather than summing every handler naively. For visits with fewer than 50 interactions, the worst interaction is commonly reported. As interaction counts grow, one highest observation is ignored for every 50 interactions. This adjustment reduces the influence of rare random stalls while keeping the metric sensitive to recurring slow behavior. Field instrumentation should capture interaction ID, target and phase details promptly while respecting privacy and data volume.
- Observe qualifying user-input events.
- Group related events into one interaction.
- Measure from input time to the next paint.
- Record event duration and interaction identity.
- Rank interaction latencies within the visit.
- Apply the high-count outlier adjustment.
- Report the representative high latency.
- Evidence for How Is INP Calculated: the raw html returned by the server
- The rendered DOM after required scripts run
- Content, links and metadata that differ between those states
- Network, console and hydration failures tied to the page
- A repeatable test at the exact URL and device context
| Concept | Meaning | Diagnostic use |
|---|---|---|
| Event entry | Timing for one input event | Inspect handler timing |
| Interaction ID | Groups related events | Avoid double counting |
| Duration | Input-to-paint latency | Overall outcome |
| Target | Interacted element | Find component |
| Interaction count | Visit activity level | Adjust outliers |
| Representative latency | Reported INP | Prioritize worst experience |
INP calculation is most useful when teams retain enough interaction attribution to reproduce the slow component under realistic conditions.
What Are the Three INP Phases?
Input delay is the time between physical input and the start of event handling. It grows when the main thread is occupied by another task. Processing duration covers the event callbacks that respond to the interaction. Presentation delay begins after handlers finish and lasts until the browser can present the resulting frame; style, layout, paint and queued work can contribute. A long total does not reveal which phase dominates. Splitting work inside the handler will not solve an input delay caused by an unrelated analytics task, while removing a third party will not fix an expensive synchronous component update. Capture all three phases with target and route context.
- Input delay: waiting before handlers start
- Processing duration: event callback work
- Presentation delay: waiting for the next frame
- Different components can dominate each phase
- One interaction can include multiple event handlers
- Attribution determines the correct fix
- Frame the decision raised by What Are the Three INP Phases.
- Render the page with its required scripts and resources.
- Compare content, links, metadata and canonical signals.
- Trace each difference to the responsible template or script.
- Apply the fix and repeat both observations.
| Phase | Common cause | Fix direction |
|---|---|---|
| Input delay | Long task already running | Yield and reduce unrelated work |
| Processing | Heavy event handler | Simplify and split logic |
| Presentation | Large render update | Reduce DOM and layout cost |
| Mixed delay | Multiple dependencies | Trace full interaction |
| Cold component | Code loaded on first action | Prepare likely interaction |
| Third-party stall | Vendor task occupies thread | Delay or isolate vendor work |
Break every slow INP interaction into its three phases before assigning engineering work or choosing an optimization.
How Do Long Tasks and JavaScript Affect INP?
A task longer than the available responsiveness budget can delay an input even when it is unrelated to the clicked control. Split large loops, parsing, initialization and component work at logical boundaries. Yielding should not leave inconsistent application state visible, so commit the minimal user-facing update first and continue secondary work later. Reduce duplicate listeners and avoid redoing global calculations inside every event. Move appropriate pure computation to a worker when messaging and serialization costs make sense. Code splitting helps transfer size, but loading and compiling a new chunk on the first action can move delay into the interaction; prepare code for highly probable primary actions without preloading every feature.
- Find long tasks near slow interactions.
- Separate essential response work from secondary work.
- Break computation at safe state boundaries.
- Yield so input and rendering can proceed.
- Reduce duplicate listeners and repeated calculations.
- Move suitable computation off the main thread.
- Prepare code for likely primary actions.
- Evidence for How Do Long Tasks and JavaScript Affect INP: the raw html returned by the server
- The rendered DOM after required scripts run
- Content, links and metadata that differ between those states
- Network, console and hydration failures tied to the page
- A repeatable test at the exact URL and device context
| Technique | Benefit | Risk |
|---|---|---|
| Task yielding | Shorter input wait | State split poorly |
| Work chunking | Frames between computation | Coordination overhead |
| Web worker | Moves pure computation | Messaging and serialization |
| Event delegation | Fewer listeners | Complex target logic |
| Code splitting | Less initial code | First-action fetch delay |
| Selective preparation | Fast likely action | Bandwidth if overused |
Main-thread optimization should create frequent opportunities for input and paint while preserving correct application state.
How Do Rendering and DOM Work Affect INP?
Update the smallest DOM region that communicates the result. Virtualize very large lists when accessibility, find-in-page and navigation behavior remain sound. Batch DOM reads before writes to avoid forced synchronous layouts. Prefer CSS transforms and opacity for suitable animations instead of repeatedly changing geometry. Keep hidden application trees from participating in expensive updates. A fast handler can still produce poor INP if it schedules a huge render, so inspect presentation delay and browser rendering events. Framework memoization or component boundaries help only when measurements show unnecessary work; indiscriminate memoization adds complexity and memory cost.
- Update only the affected component region
- Batch layout reads before writes
- Limit active DOM size where appropriate
- Avoid repeated geometry-changing animation
- Prevent hidden trees from unnecessary rerenders
- Measure presentation delay after handler completion
- Frame the decision raised by How Do Rendering and DOM Work Affect INP.
- Render the page with its required scripts and resources.
- Compare content, links, metadata and canonical signals.
- Trace each difference to the responsible template or script.
- Apply the fix and repeat both observations.
| Finding | Fix direction | Regression check |
|---|---|---|
| Large rerender | Narrow update scope | Correct visible state |
| Forced layout | Batch reads and writes | Geometry accuracy |
| Huge list | Pagination or careful virtualization | Accessibility and discovery |
| Layout animation | Transform when suitable | Focus and reduced motion |
| Hidden tree updates | Pause inactive work | State restoration |
| Large paint | Reduce affected visual area | Design fidelity |
A responsive interaction updates the minimum necessary visual area and gives the browser enough time to present the result promptly.
How Do You Improve INP?
Begin with field attribution to find real route, target and device patterns. Reproduce the interaction on representative hardware, then inspect input, processing and presentation phases. Remove or reschedule unrelated work that blocks input. Make the essential state change small and visible, then continue optional calculations asynchronously when safe. Reduce client activation work through focused hydration and avoid making primary actions wait for cold code. Review resource scheduling, but remember that INP after load is often dominated by execution rather than transfer. Retest keyboard, touch and pointer behavior.
- Find the real slow interaction and target.
- Decompose its three latency phases.
- Remove competing long tasks.
- Simplify the essential event handler.
- Commit immediate visual feedback.
- Defer secondary safe work.
- Reduce DOM and rendering scope.
- Confirm field improvement after release.
- Evidence for How Do You Improve INP: the raw html returned by the server
- The rendered DOM after required scripts run
- Content, links and metadata that differ between those states
- Network, console and hydration failures tied to the page
- A repeatable test at the exact URL and device context
| Finding | Candidate fix | Verification |
|---|---|---|
| Input delay | Yield unrelated work | Early input trace |
| Long callback | Reduce and chunk handler | Processing duration |
| Cold interaction code | Prepare likely action | Network and field data |
| Large DOM update | Narrow render scope | Presentation delay |
| Hydration competition | Prioritize critical controls | Immediate-action test |
| Third-party task | Delay or isolate vendor | Business and timing check |
The strongest INP fix shortens the dominant phase of a real interaction while preserving correct feedback, accessibility and application state.
How Do You Audit Interaction to Next Paint?
Start with the 75th-percentile distribution by mobile, desktop and route family. Collect privacy-safe target or component attribution and interaction type. Select common and slow actions such as menus, filters, search, add-to-cart, form validation and modal controls. Reproduce them on mid-range hardware with realistic data. Record event timing, long tasks, call stacks, DOM updates and rendering events. Test early input during page load as well as later interactions. Pair the audit with JavaScript SEO, client rendering and CLS checks so responsiveness fixes do not destabilize the interface.
- Segment field INP by device and route.
- Capture interaction type and target attribution.
- Identify dominant input, processing or presentation delay.
- Reproduce actions on representative hardware.
- Trace long tasks, handlers and DOM updates.
- Test early and long-session interactions.
- Verify affected shared components.
- Monitor production percentiles after release.
- Evidence for How Do You Audit Interaction to Next Paint: the raw html returned by the server
- The rendered DOM after required scripts run
- Content, links and metadata that differ between those states
- Network, console and hydration failures tied to the page
- A repeatable test at the exact URL and device context
| Check | Evidence | Pass condition |
|---|---|---|
| Population | 75th-percentile segments | Affected routes known |
| Target | Interaction attribution | Component identified |
| Input delay | Event timing | No avoidable task wait |
| Processing | Callback trace | Bounded handler work |
| Presentation | Rendering trace | Prompt next frame |
| Device | Representative hardware | Realistic result |
| Regression | Interaction suite | Actions stay correct |
| Release | Field trend | Sustained improvement |
Start with a relevant free SEO check, continue the evidence workflow in Crawl Explorer, and review pricing when comparing continuous monitoring with a one-time manual review.
A complete INP audit connects a real-user responsiveness outcome to one interaction, one dominant phase and one verified component fix.